
WELCOME TO OUR NEW BITCOIN (BTC) ON-CHAIN ANALYSIS FOR JULY 2021. WE GO IN DETAIL IN ALL THE METRICS AND CORE STATS THAT SHAPED THE BITCOIN MARKETS DURING THE LAST FEW MONTHS SPECIALLY FOR JULY 2021. COVERING FROM MAIN INDICATORS, CRYPTO WHALE WALLETS , FUTURES VOLUME AND MUCH MORE.
Remember also to subscribe to our Deep Tech newsletter here, which we send to our Investors & Audience, covering the trends, technologies and companies within our portfolio in MobileyourLife and Urano Capital.
BITCOIN (BTC)
BTC during the month of July 2021 continued the sideway markets that we have experienced since May 2021 following the bearish trend.
Bitcoin had a rally within the last week of July and we want to lay out the several narratives within the Bitcoin Space that led to the changes we experienced during July.
Beside covering the main bearish and bullish signals , we want also to cover the main events that shaped the Bitcoin markets.
China Crackdown and BTC miners migration from China to other jurisdictions
Grayscale Unlocking during July 2021
BTC Taproot upgrade
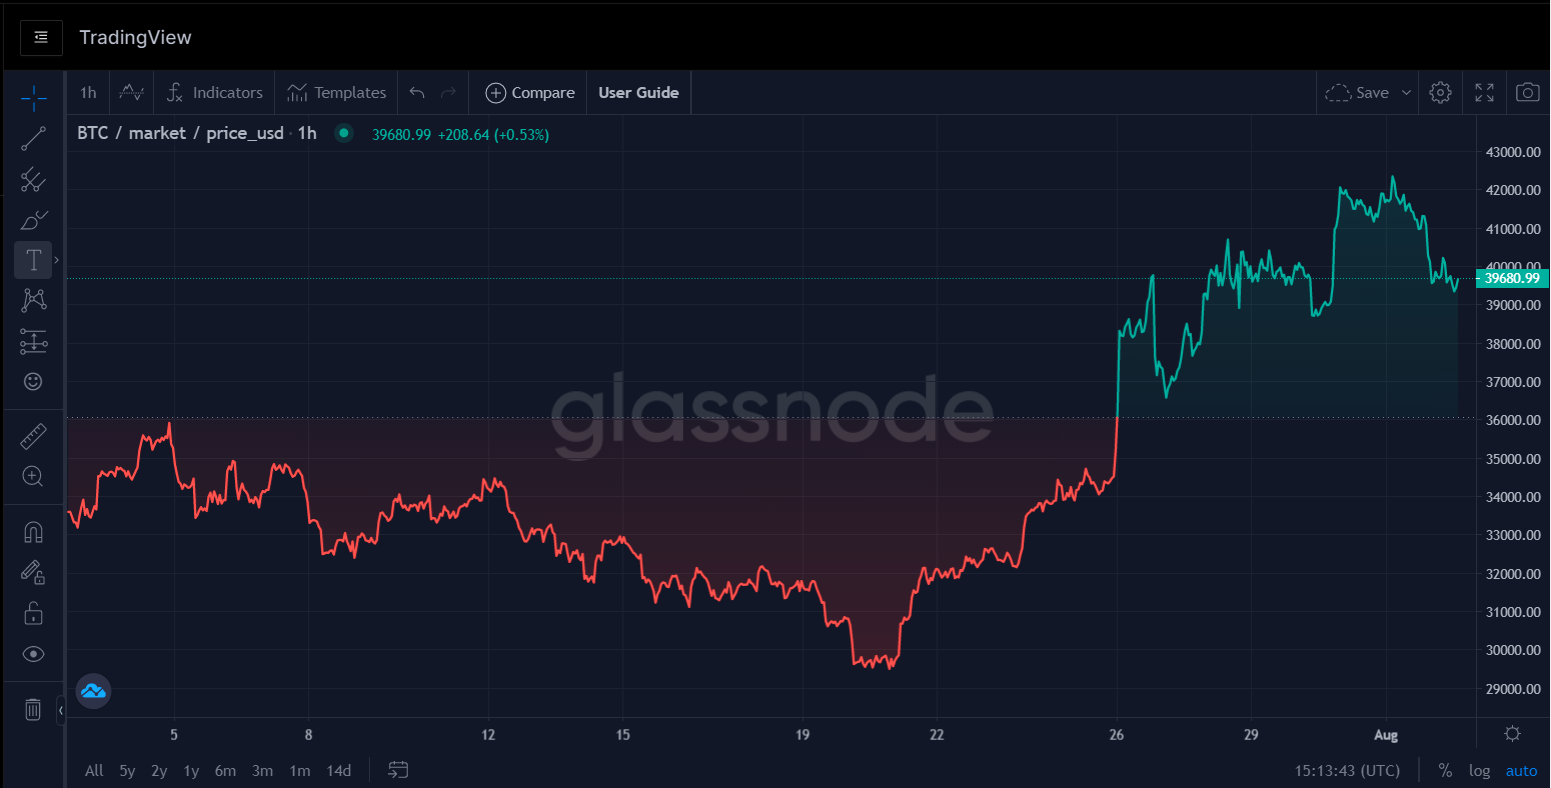
Opening on a price of USD 34,300 USD , it made a quick bull movement up to USD 36,381 USD on June 29th.
From there it went down to a price of USD 34,816 on June 30th. Reaching a new low price. This same trend continued for the next 3 days reaching multiple prices during the bearish movement of USD 34,221 on June 30th, USD 33,636 on July 1st and USD32,836 respectively.
Following the trend during the 1st week of July with the very unpredictable swings from BTC, it reached an all time high (ATH) of USD 35,911 which lasted only 24 hours after decreasing the price down again to USD 33,460. From that point Bitcoin couldn´t break the resistance level of USD 35,000. It had the first try to break the resitance level on July 6th after going down again to USD 33,718 and then repeating the same cycle within the next 48 hours to USD 33,850on July 7th.
On the 2nd week of July it did reached a new level of USD 32,489 per Bitcoin when it tried to recover, reaching that same week a price of USD34,014 and then USD 34,447 per bitcoin on July 11th. We can note so far that Bitcoin markets were not able to catch a strong signal whether bullish or bearish which led to a massive decrease of the price to USD 29,633 per Bitcoin on July 20th.
The last 10 days of July Bitcoin was able to recover the previous levels in its price with a quick bullish trend going from USD 29,621 to USD 39,778 on July 26th breaking the resistance point of 35K USD and reaching an ATH. It was after 48 hours that Bitcoin was able to break the 40K level and reach a price of USD 40,670. On 07/30 was trading at USD 41,800 per Bitcoin.
BTC WALLET MOVEMENT
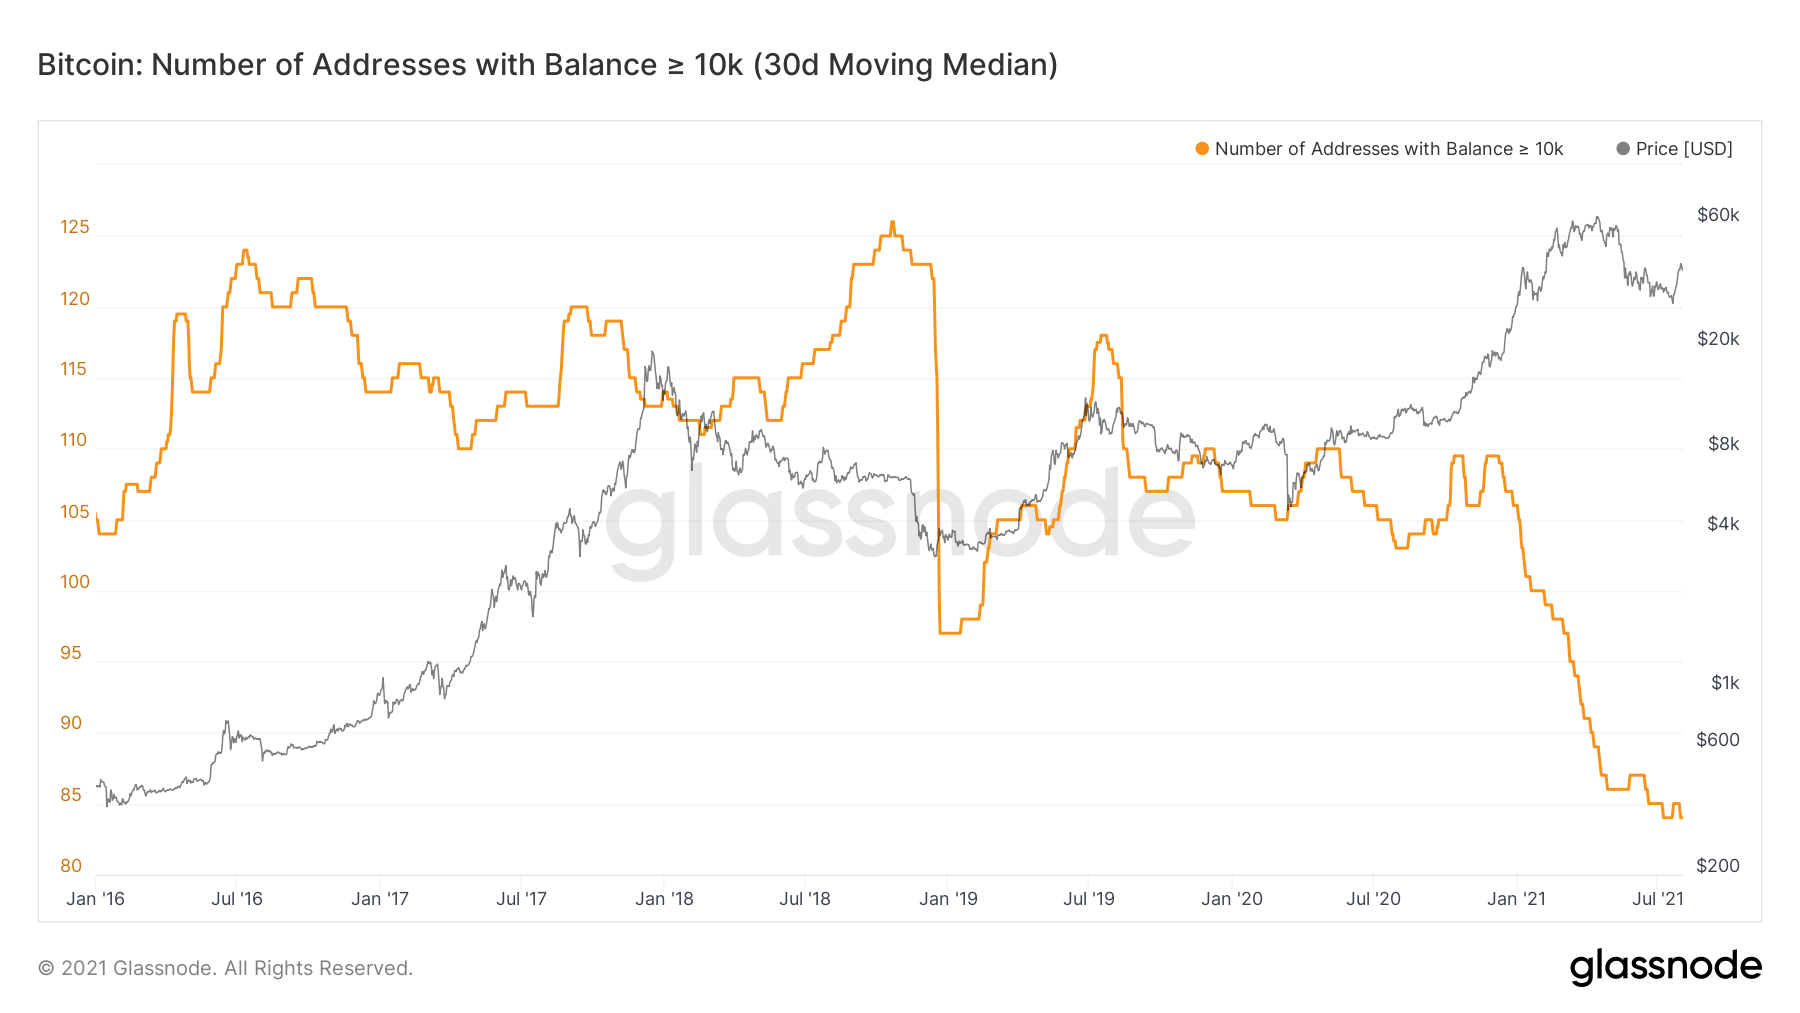
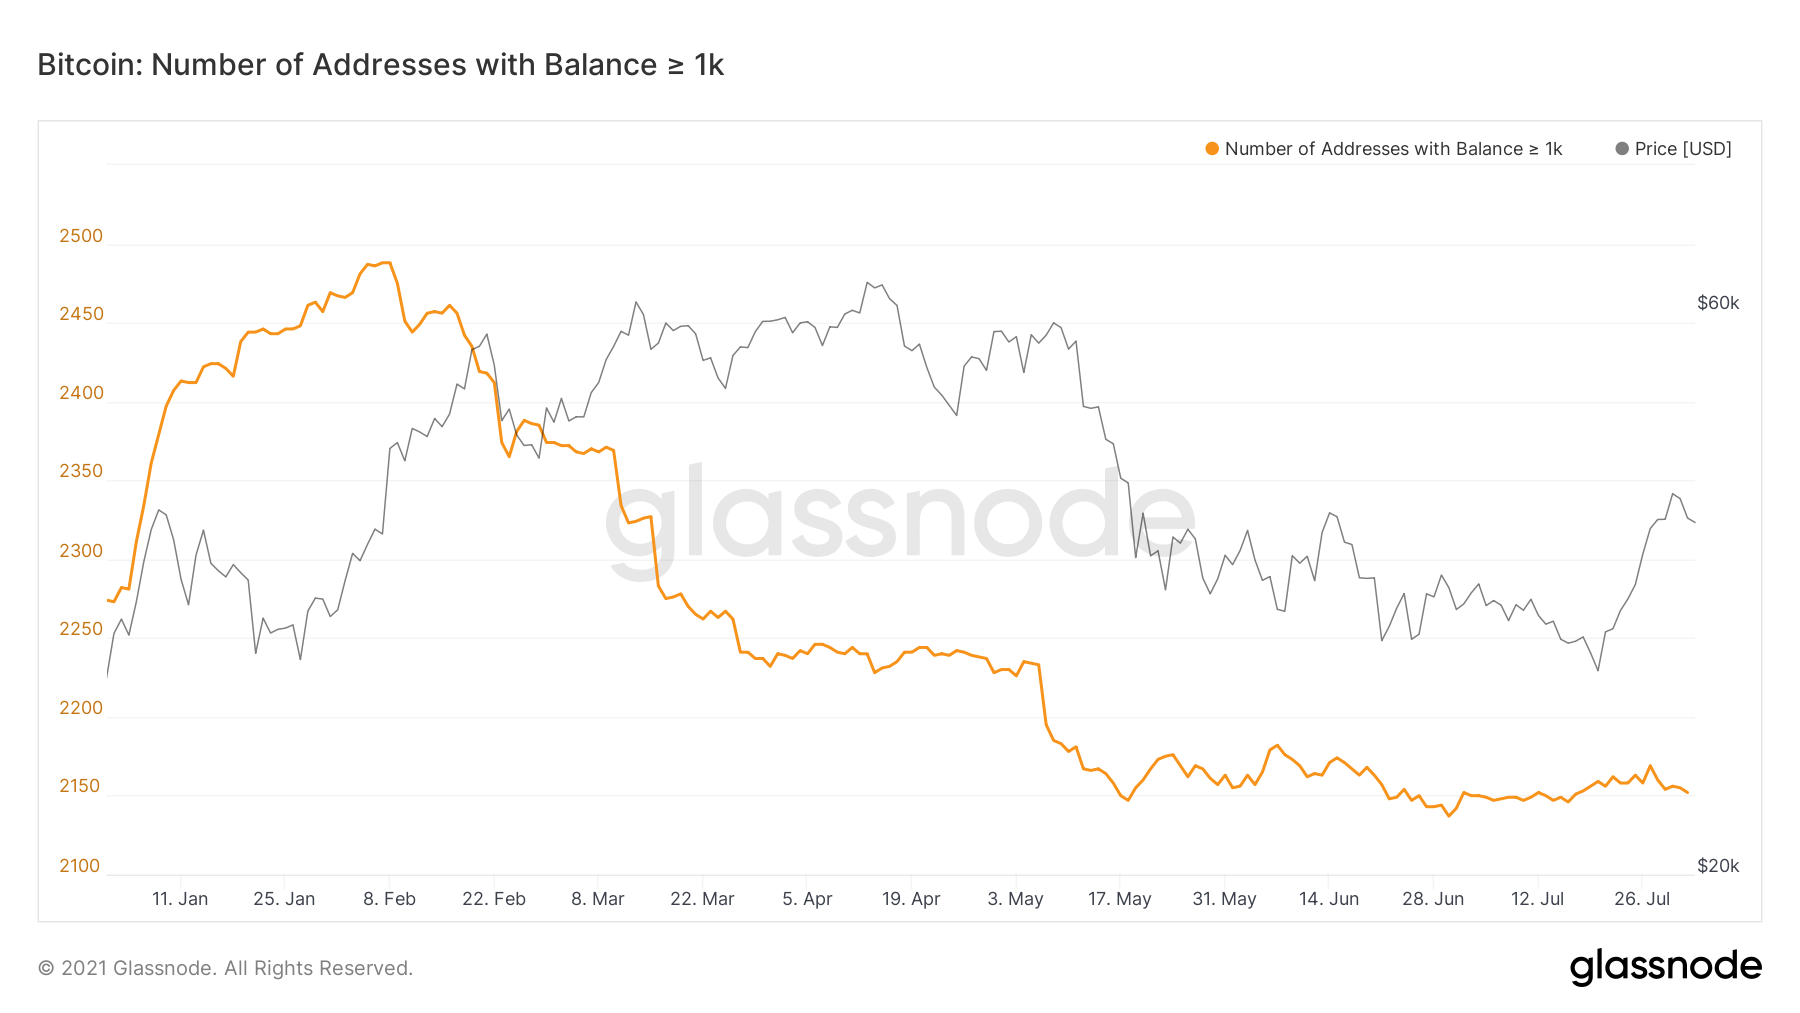
It is no surprise that we have seen in the first semester of 2021 a decrease of the Bitcoin Wallets. Bitcoin wallets ≥ 1K Bitcoin went down since February 2021 from 2,488 wallets to 2,160. Same pattern we observed on wallets ≥ 10K Bitcoin with 101 wallets back in February down to 85 wallets in July.
This clearly denotes the Whales behaviour in the Bitcoin space. Recently Crypto Whales moved over 1BN USD from Coinbase to unknown wallets. According to Whale Alert a blockchain tracking platform highlighted the movement of 30,640 BTC from cryptocurrency exchange Coinbase to Digital Wallets.
Despite the Institutional interest the last few months as we mentioned in our earlier reports which you can check here , the largest cryptocurrency saw a dip in institutional inflows.
According to CoinShares BTC saw 24 MM USD of outflows during the 3rd week of July , largest outflow since June.
BTC ADDRESSES
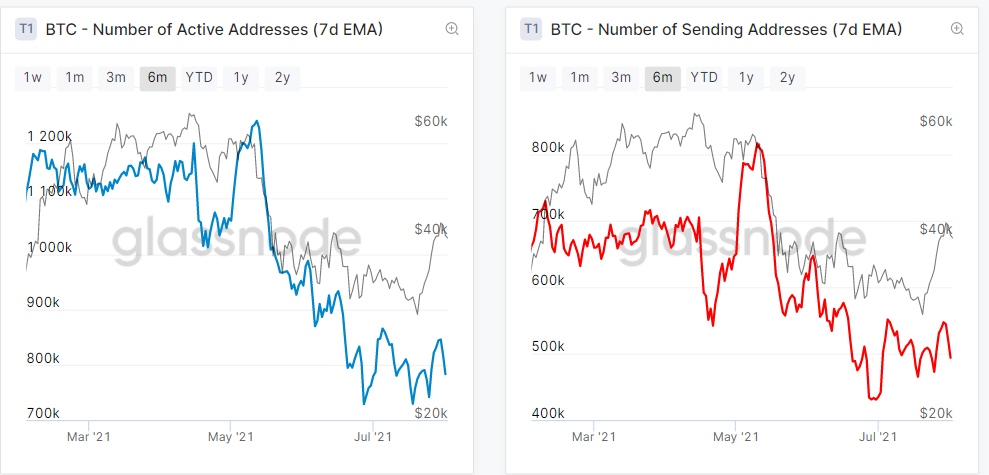
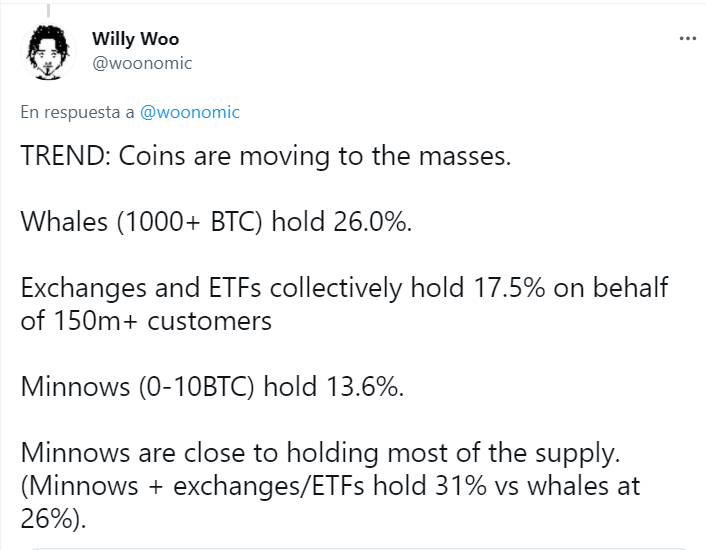
According to Willy Woo (Bitcoin on-chain anaylist) points out that the coins are moving to the masses. The distribution currently stands as Whales (1000+BTC) currently holding about 26% .
Exchanges and ETFs collectively holding 17.5% on behalf of 150mm + customers and Minnows (0-10 BTC) hold 13.6%
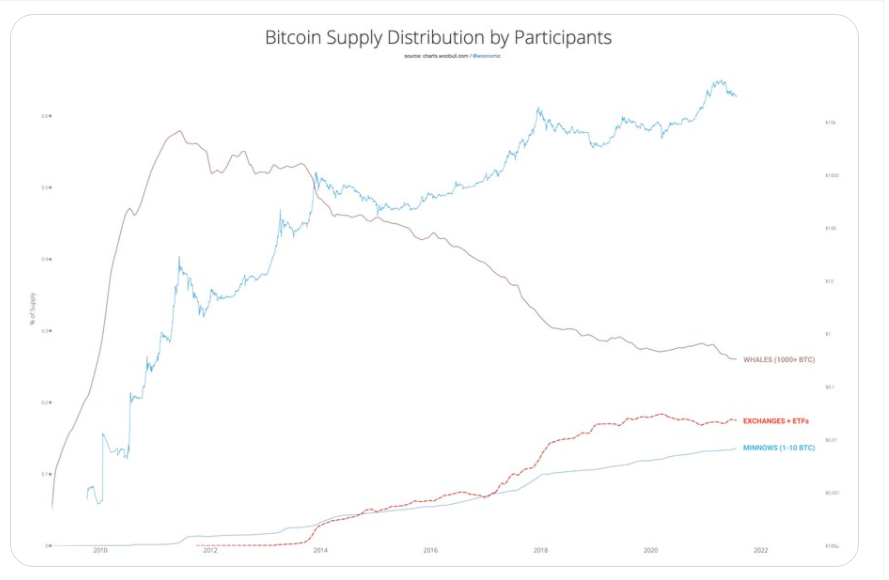
Minnows + Exchanges/ETFs hold 31% vs Whales at 26%).
While Whales still hold a significant portion of the market and Institutional Investors will continue acquiring Bitcoin during the rest of the 2021. The trend seems to point that the masses will acquire and get more stake on the Bitcoin Space.
BTC EXCHANGES ACTIVITY
NET FLOW VOLUME IN EXCHANGES
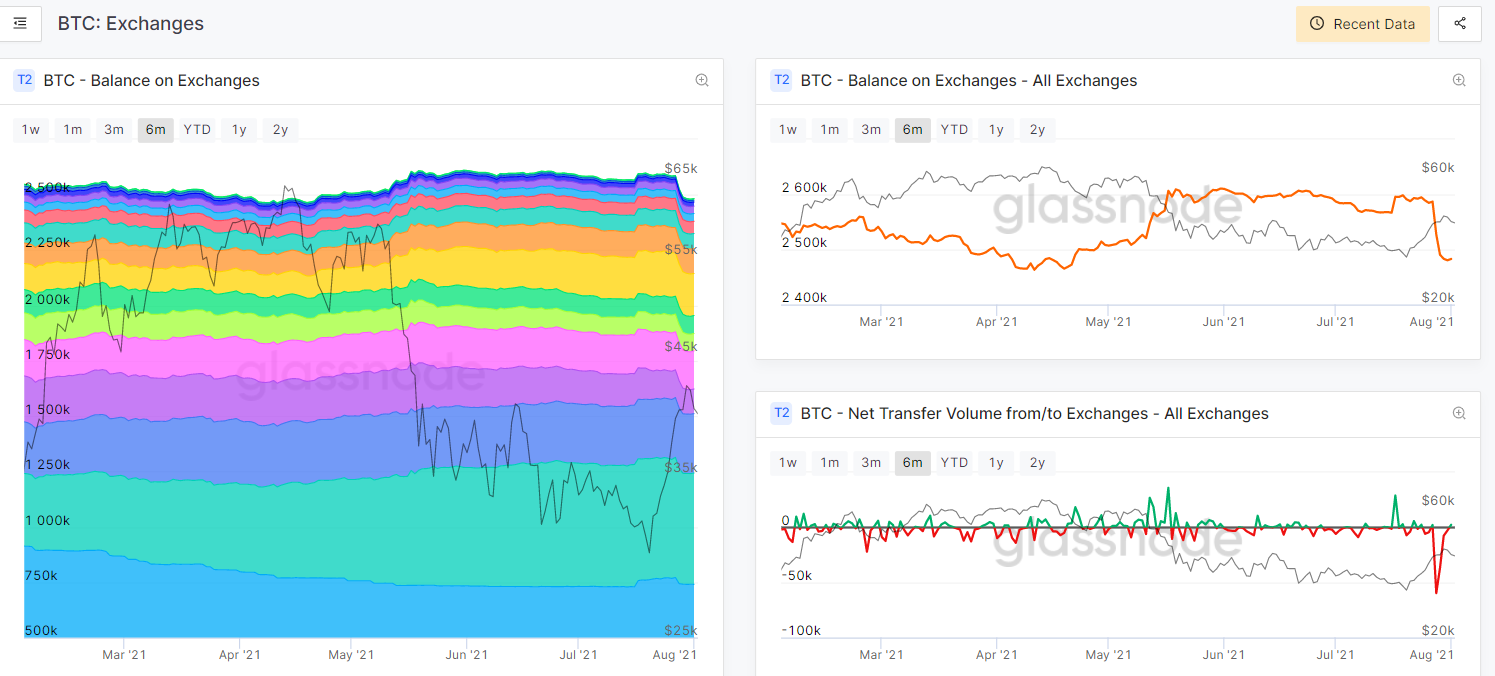
Observing the 2nd quarter of 2021 we have seen a massive negative net flow volume from/to exchanges of -59,674 BTC on July 28th.
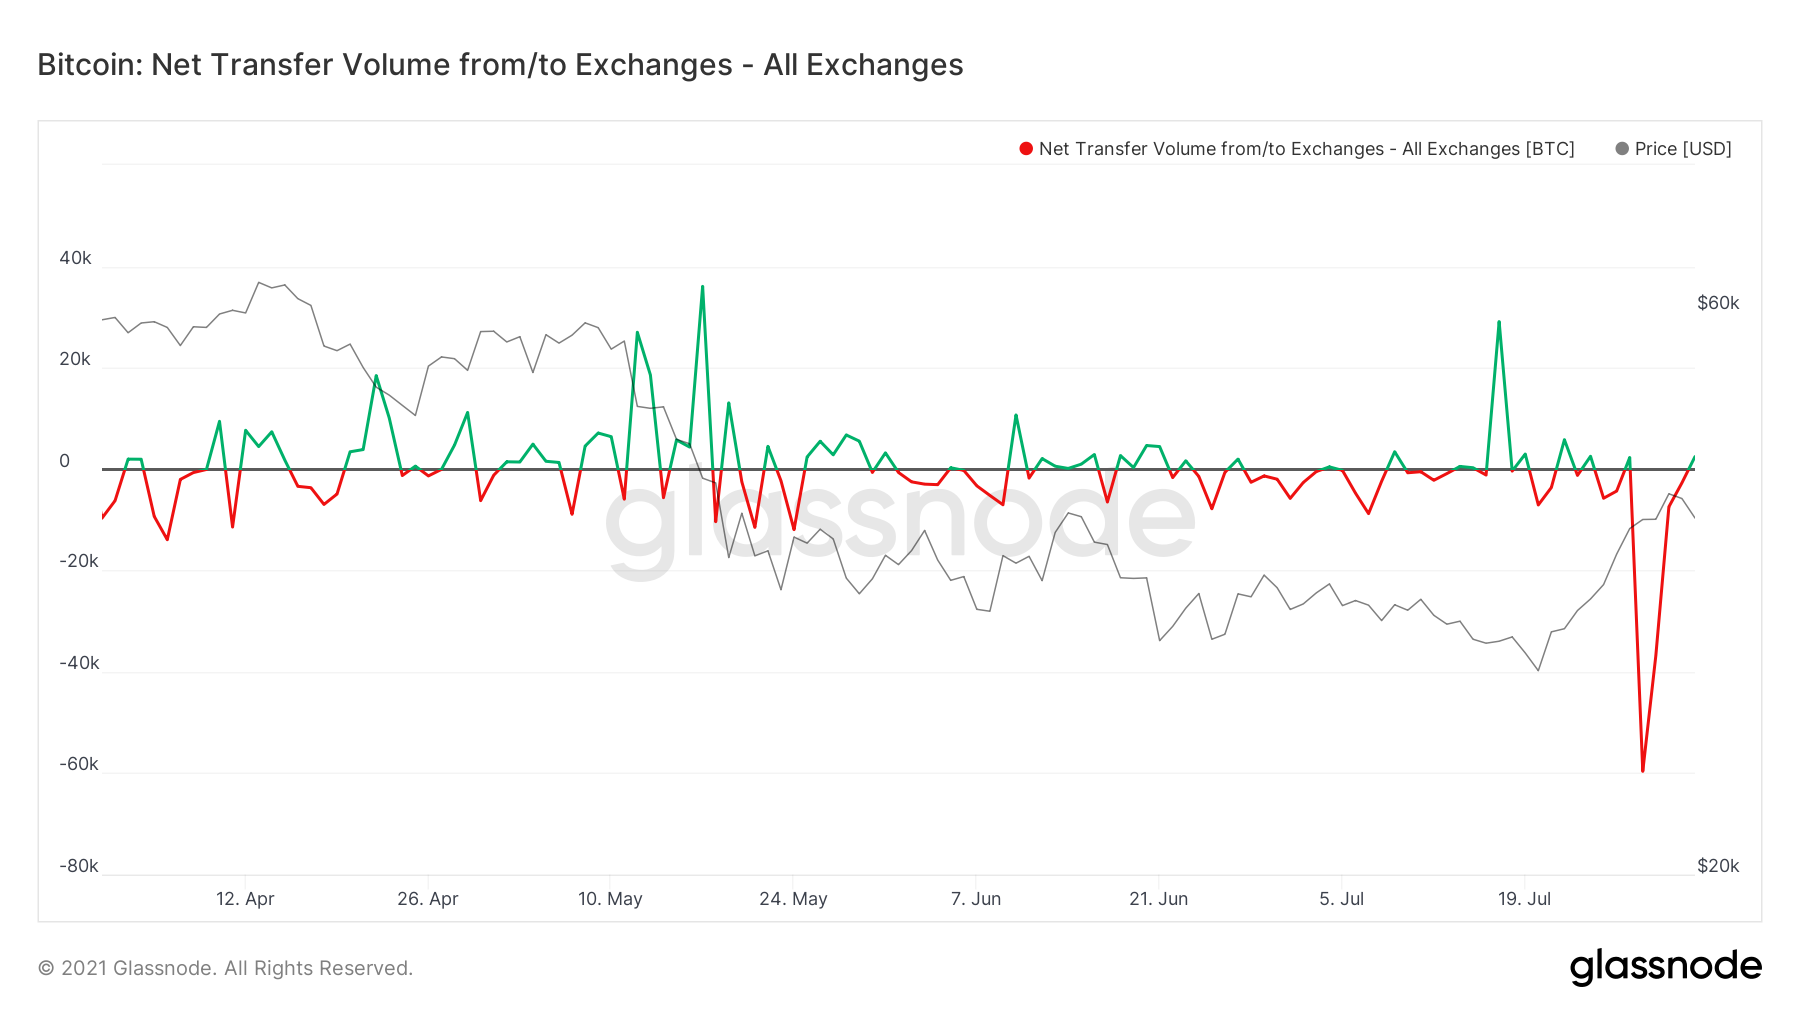
This depletion of exchange coin reserves, with many of them according to Glassnode on route to Grayscale GBTC Trust , or be accumulated by institutions. The fall in exchange reserves appears to have coincided with an uptick in capital flows to decentralized finance (DeFi) protocols over the past fortnight.
According to DeFiLama the total value locked (TVL) on DeFi markets went from 98.6 BN USD to 118 BN USD from June to July 2021.
BTC HODLERS ACTIVITY
The first semester of 2021 the ASOL indicator (Average Spent Output LifeSpan). This provides insight into the balance between short-term (young coins) and long-term (old coins) spending behaviour over a period of time.
High values typically indicate an increased proportion of network traffic are old coins being spent, often associated with long term holders taking advantage of high market volatility.
Low values typically indicate day-to-day traffic comprised mainly of young coins being spent, often associated with traders and short term holders.
We had the following movements on the metric
On January 2021 was on a very high level of ASOL 92.02, usually indicating a high traffic of old coins being spent. This movement is associated with long term holders taking advantage of the price of Bitcoin.
After that ASOL indicator start a decrease touching a low point of 36.26 on February when the BTC price was at USD 35,524. And then on April 19th the metric was at 27.16 when BTC price was trading at 53K USD.
From that period of time within Q2 2021 it started again a sideway cycle on the indicator going up to 59.41 on mid May 2021 to decrease massively to 23.42 on July 3rd and currently at 36.32.
The last quarter we can observe from the low indicator that has been dominated by young coins being spent which are often associated with short term traders and short term holders.
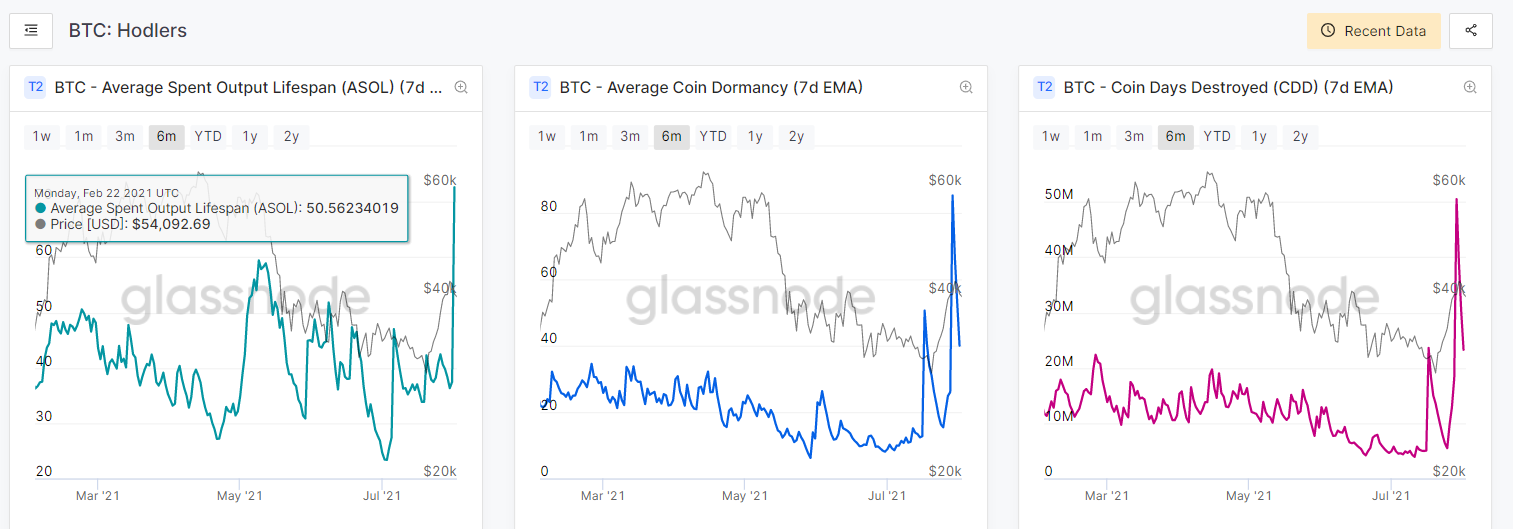
Regarding BDD indicator (Bitcoin Days Destroyed) it provides us an insight on the maturity of the coins (Bitcoin) and when they are moved. It also measures the velocity of the Bitcoin Network and how is the behaviour when coins are moved from one wallet to another within the blockchain. And it provides a better insight of the movement of coins rather than observing the trading volume.
Within the indicator we have seen a dramatic increase on July when it went from a CDD 4,904,293 to a CDD of 23,596,841 on July 15th and then going up to 50,485,762 on July 29th. Which tell us also how the long term holders or mature investors have been moving their coins this last month. Which also supports the movement of whale wallets or smart money investors within the last quarter.
Same point goes to the Bitcoin Average coin dormancy which is defined by the average number of days destroyed per coin transacted. It is one of the most important indicators on the Bitcoin economics as well as the onchain volume. Because it measures the activity of the old holders of Bitcoin (Smart Money) and when are they accumulating Bitcoin (which usually happens in the market bottoms) and when smart investors are distributing (releasing expensive coins).
The destruction describe the actions of mostly a single market actor: Old hands selling or spending their Bitcoins (BTC). Instead of trading volume as we mentioned before which is two market actors: buyers and sellers dealing with investor flows at different prices. Regarding the behaviours, high destruction means a bearish market (old coins released into circulation) and low destruction is neutral ( since implies holders are maintaining their position but not necessarily that buyers are coming in).
From last quarter and specially the month of July we can apprecciate that BTC dormancy came from a low average coin dormancy (ACD) of 6.18 on June 1st to increase rapidly to 26.314.
After that, experiencing two rises of 50.58 on July 17th and then a maximum point of 85.25 ACD on July 29th. Which can be interpreted as the movement of older coins/long holders (smart investors) releasing its coins to the network.
BTC NETWORK METRICS
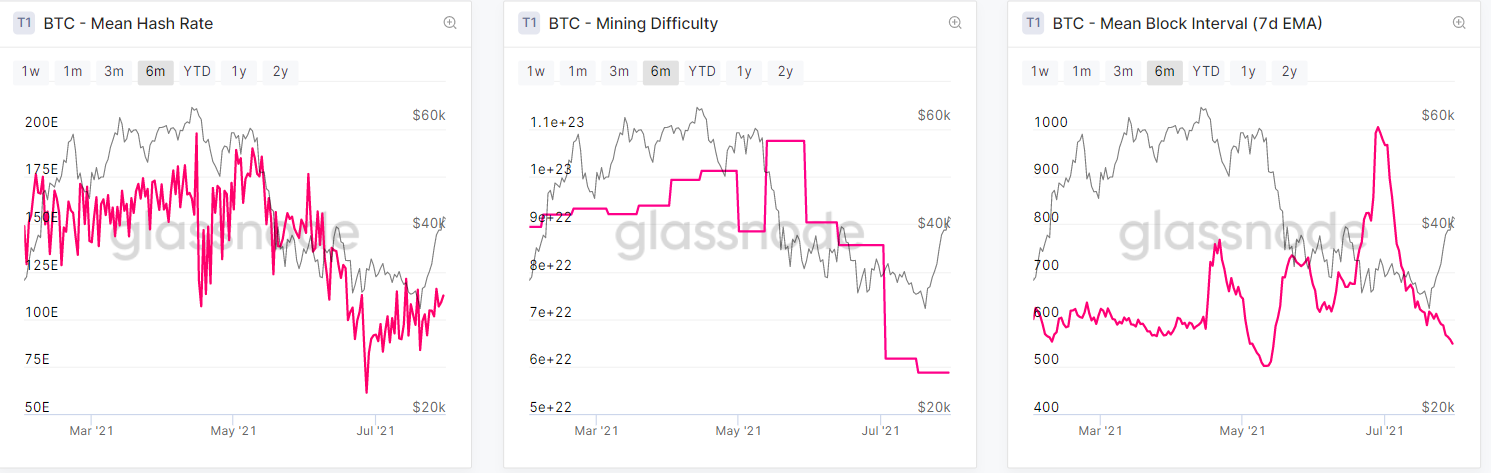
We always want to measure the Bitcoin core on-chain metrics and specially the Bitcoin Mean Hash Rate. As it measures the computational power, when we note a high BTC hash rate it indicates as well a high security of the network.
It is no news that with the recent crack down from part of the Chinese Central Bank on Cryptocurrencies and the People`s bank of China confirming the high pressure on virtual currencies, including the restrictions on Bitcoin (BTC) mining as well. It has caused the BTC hash rate dropping by 76% within the last quarter.
That has lead to a massive migration of Bitcoin miners that were in China to rellocate to new jurisdictions Which is positive for building a more robust and decentralized network in regards of the miners location.
From April 15th the hash rate went down from 197 eH/S to 61 EH/S on June 27th , being in jeopardy the bitcoin network and its stability. It quickly recovered going up to 112 EH/S by the end of July as miners went back online. Nevertheless the migration from Chinese miners to other Jurisdictions including the US will be a trend to keep an eye the rest of 2021.
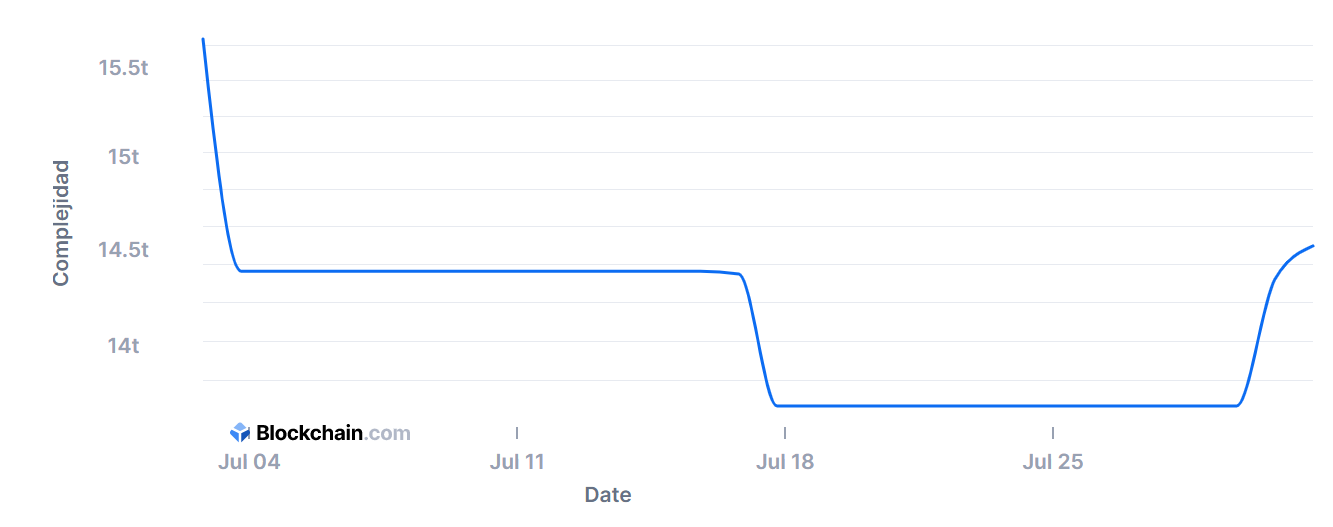
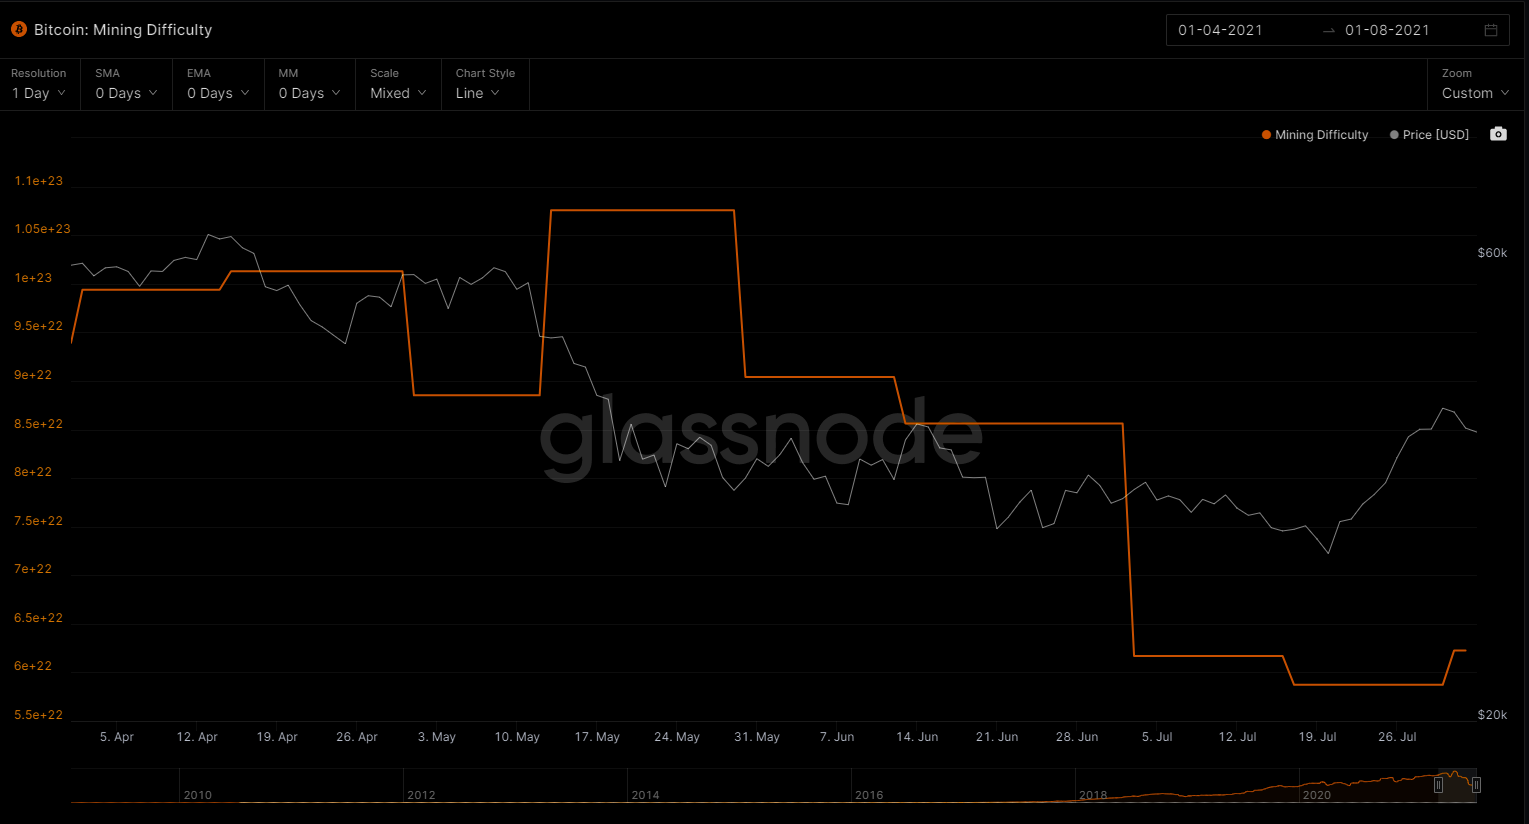
On the other hand the recent BTC mining difficulty had an increase from 13.673 to 14.4 trillion. According to BTC.com it has been the first increase since the crash in May and a 6% increase according to Decrypt.
In essence the Bitcoin mining difficulty measures how much computer power is required to earn Bitcoin from validating transactions on the network adjusting once a fortnight to reflect the competition among the BTC miners.
As we said earlier in regards with the BTC hash rate that the more compute power in the network the more secure. The same applies with the difficulty. The more miners trying to earn Bitcoin, the more difficult ( increase of the BTC mining difficulty) appears.
Difficulty decreased in June and July after Chinese miners representing 65% of the network hash rate , emigrating on masse or sold mining machines to foreign farms.
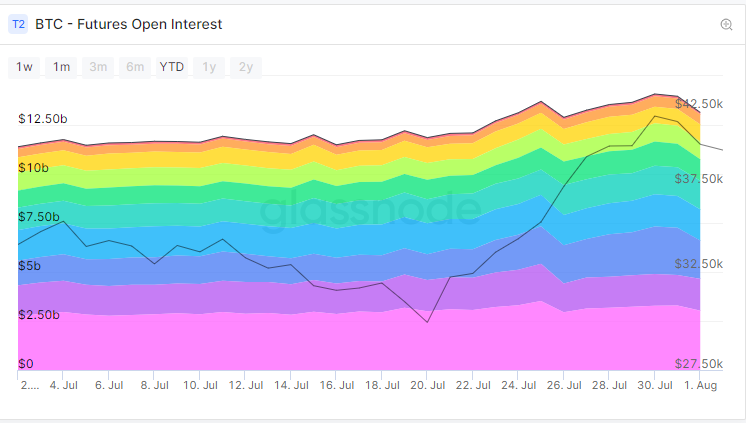
BTC DERIVATIVES
The Future open interest or the total open contracts on Bitcoin. Closes July with Binance exchange being the leader with 3BN+ USD on contracts, followed by FTX with 1.9BN USD and then ByBit 1.6 BN+ USD.
FTX exchanges surpassed ByBit during July as the open amount in July for ByBit was 1.5 BN USD and FTX 1.2 BN USD going from that level and closing on the 2nd place.
With the BTC open interest helps us understand the nature of how much capital is flowing in the market and if is increasing or decreasing. And is a measure of market activity.
FUNDING RATE
In relation of Futures funding rate is a premium that Futures Traders have to pay to keep an open position. When is positive it means that long trades must pay a premium for the trade to remain open. When the funding is negative short positions pays to long positions.
Funding rate is usually correlated to the market sentiment. When the market is extremely bullish funding rates across all exchanges tend to go higher. Likewise when the market is bearish, the funding rates tend to go lower. For example if the BTC / USD contract price trades above the spot price it means that many traders are in leverage long positions. On the other hand if BTC/USD contract price trades below the spot price it means there are more traders with short positions.
For most of the month of July we can see the rate negative on levels from - 0.007% to -0.017% to decreasing to -0.016% and -0.022% reflecting the bearish signals that Bitcoin had all over the month of July. It was only until the end of the month when funding rate became positive in the levels ranging from 0.002% -0.007% which correlates with the rally of BTC at the end of the month.
Funding rate usually works against popular traders. If most traders are long BTC then the funding rate tend to increase and that confirms the buying interest. If more traders are shorting Bitcoin then funding rate tend to go negative and that confirms the selling interest.

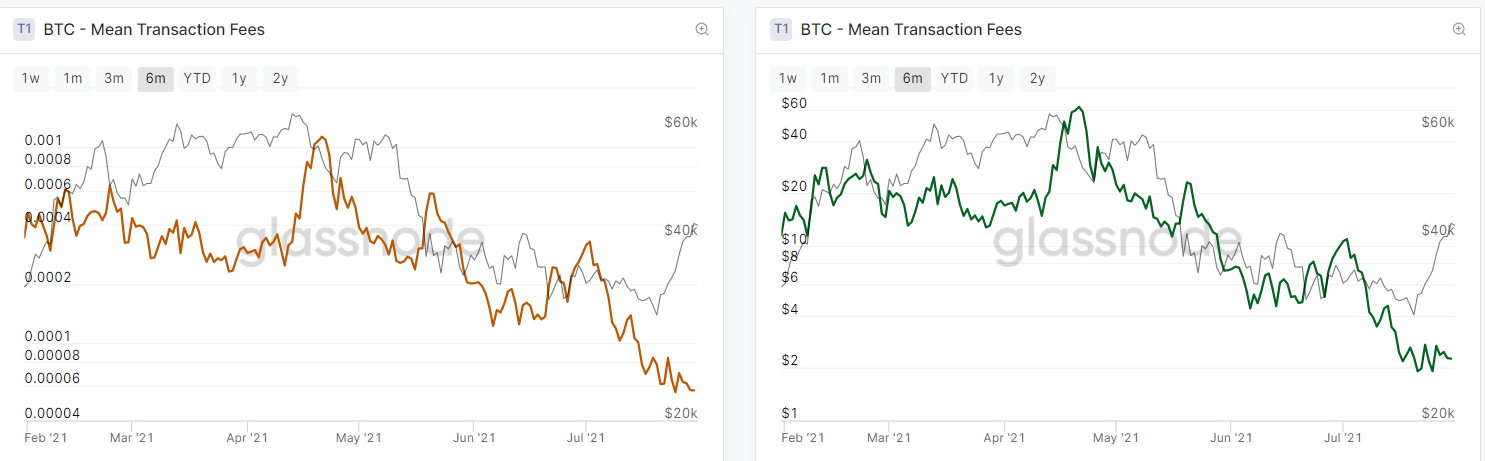
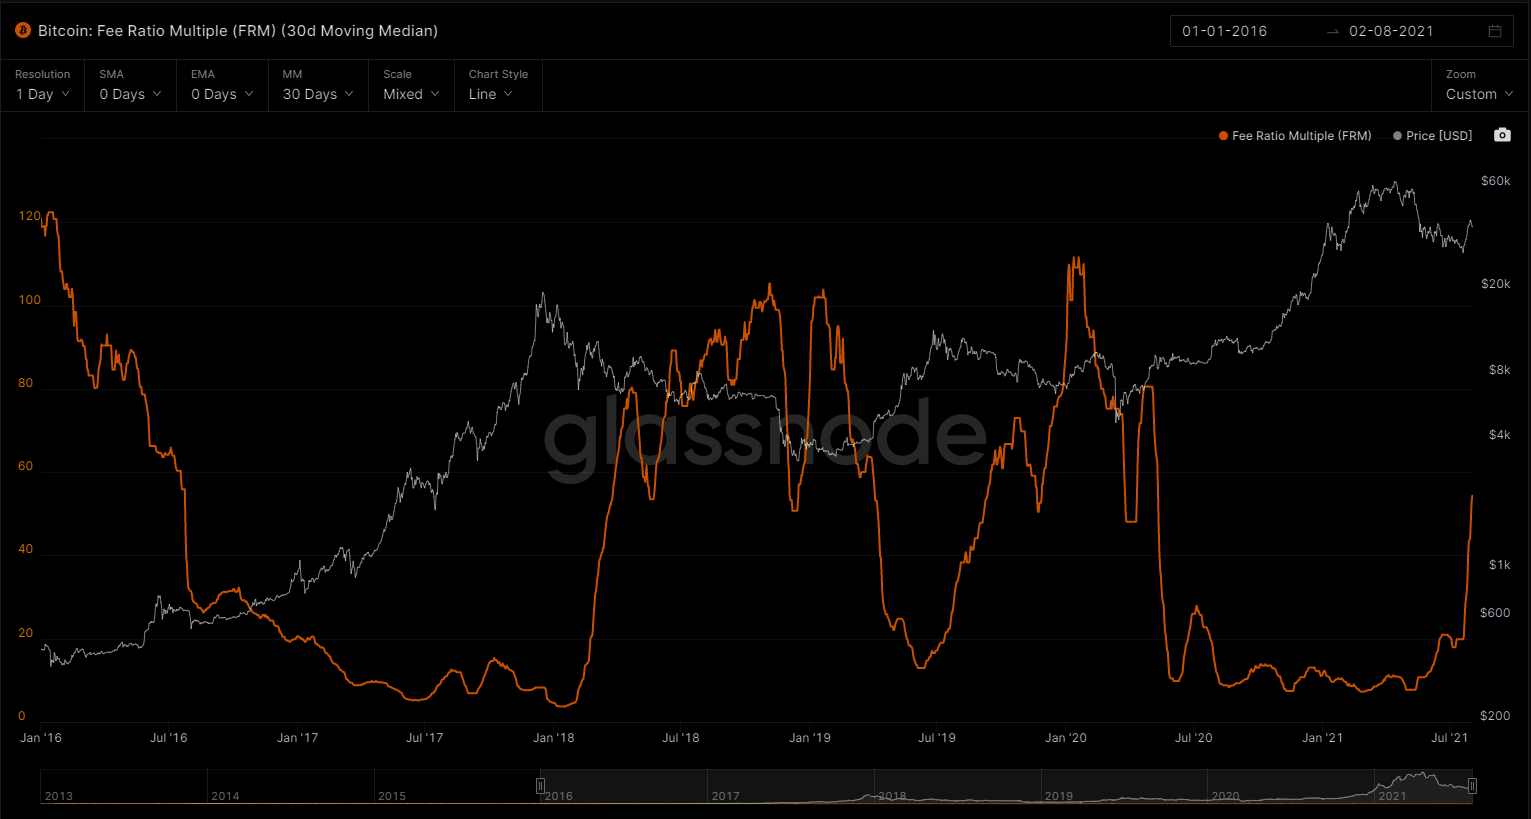
BITCOIN FRM RATIO
The Fee Ratio Multiple (FRM) is defined as the ratio between the total miner revenue (blocks rewards + transaction fees) and transaction fees.
FRM is a measure of a blockchain's security and gives an assessment how secure a chain is once block rewards disappear.
For the mathematically inclined, the Fee Ratio can be expressed as follows:
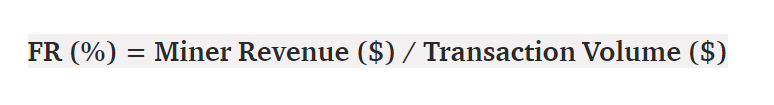
FRM is explicitly about security, which should be considered the foundational layer of the chain stack. By looking at FRM we can deduce how secure chains will be once block rewards disappear.
A low FR means that users can transact securely while simultaneously paying a minimal % of each transaction as a fee. Conversely, a high FR means that users have to pay a high % of each transaction as a fee in order to transact securely.
FRM can only be applied on a block reward halving cycle basis — i.e. for BTC, looking at FRM in the period between 2012–2016 and then 2016–2020.
This is because FRM has to trend towards 1 as block rewards become negligible. By measuring over 4 year periods you keep block reward as a constant and measure its changing relationship with transaction fees.
Currently we can see that from last halving back in May 2020 it went from a top of 80.50 the ratio down to 9.86 on June 2020. Staying on levels of 7.72 during 2021 and then more recently increasing the FRM ratio up to 54.3 on July 2021.
A low FRM suggests that an asset can maintain its current security budget (miner revenue) without having to rely on an inflationary subsidy.
Conversely, a high FRM suggests that an asset will require heavy inflation via block reward subsidies in order to maintain its existing security budget.
TAPROOT UPGRADE
Taproot is a proposed upgrade to Bitcoin which will bring several new features and benefits to Bitcoin users. These upgrades introduce new, more efficient, flexible, and private ways of transferring bitcoin. Which improves the security and scalability of the network.
Schnorr signatures will bring several benefits to Bitcoin users, including superior privacy, lower fees, and more flexible multisig.
GRAYSCALE PREMIUM
Grayscale Bitcoin Trust the largest Bitcoin Asset manager who provides to institutional investors exposure to Bitcoin (BTC) and other Digital Assets through their trust. Currently holds around 650,000 BTC an estimated value of 25 BN USD at the time of press release.
Very close to an ETF for Bitcoin it became quite attractive by Institutional and HNWI that can buy shares the fund and with a 6 month lock -up period and sell them on a secondary market under the ticker GBTC.
Due to the lack of alternatives for high caliber investors at the beginning of 2021 GBTC was trading at premium up to 14.25% in February 2021. However the Grayscale Premium started to declined and started trading negative during 2021 currently at -10.27%. Which means that Grayscale stop acquiring BTC and their holdings have been stagnating recently.

During the month of July one of the main events was the GBTCs unlock. About 40,000 BTC were unlocked worth more than 1.32 bn USD from the Grayscale Bitcoin trust. The biggest of these unlocks were set to happen on July 18th when 16,240 BTC will be available due to the release of the six-month lock-in period.
Most of the market analysts were afraid that could signal a huge bearish trend in the Bitcoin markets were about to happen. (same case that happened in Feb 2021 when Grayscale unlock 20,000 BTC which led to the bearish market).
But on the other hand Sam Bankman-Fried, CEO of crypto derivatives exchange FTX, doesn’t agree with opinions about the impact of the upcoming Grayscale Bitcoin Trust (GBTC) unlock.
On-chain analyst Willy Woo agrees with Sam Bankman-Fried as he predicts that the long-term impact of the GBTC shares unlock is neutral.
He says the arbitrage opportunities presented by the unlock tend to balance out over time as the expected plummet in the value of GBTC shares incentivizes investors to buy at a discount.
That`s all for today. Hope you enjoyed!
Please like, comment and share :)
Remember to subscribe to our newsletter
MOBILEYOURLIFE GROUP